Attention brands and marketers, Facebook turned 20 this year! Unlike the Friendsters and Vines of the world, Facebook continues to dominate when it comes to usage and market penetration. It has not yet gone to be with its digital ancestors. So, let’s celebrate one of the OGs of social media platforms. 🥳
With market trends playing such a significant role in building effective marketing strategies, we thought it would be worth it to take a look at the Facebook stats marketers like you need to know. (We also have a bunch of influencer marketing stats that can help provide a bit more context for the data included in this post.) So here’s a breakdown of the most relevant Facebook stats every marketer should know.
Global Reach and User Demographics
#1. As of the end of 2024, Facebook boasts more than 3 billion monthly active users.
Wild, right? The platform retains its title as the largest app globally. This user base isn’t just vast; it’s diverse. India has the most Facebook users with more than 366 million users. That’s about 25 percent of its population. The U.S. and UK follow with significant penetration rates of 51 percent and 55 percent, respectively. Know what that means? It means 37 percent of Earth’s population is on Facebook. One in every three people you meet.
#2. Facebook is still growing.
Sure, the chatter around the virtual water cooler is that young people are moving away from Facebook, but last year, the change in monthly active users for Q1 of 2023 was +26 million. Just sayin’.
#3. Facebook users are aging up.
Holy crap! Remember when Facebook was for college students? Well, those college students are twenty years older. And their parents, grandparents, and children are on the app as well. A growing number of Facebook users are over the age of 65, comprising six percent of Facebook users. Let’s flip it though – 58 percent of Americans over the age of 65 are on Facebook. This proves that Facebook maintains appeal crosses generational boundaries.
#4. Only 33 percent of teenagers report having an active Facebook account.
That’s a sharp drop from 71 percent from 2014 to 2015. This suggests that younger audiences are migrating to other platforms, like Instagram and TikTok. It signals the shift in marketing strategies to reach this age group.
Facebook Usage Patterns
#5. Nearly 7 in 10 Facebook users (68 percent) log in every single day.
Despite the rise of various social media platforms, Facebook continues to dominate by maintaining a loyal and active user base that relies on the platform for staying connected and informed. This daily usage underscores the platform’s relevance and the habitual nature of social media consumption in today’s digital age.
#6. The average Facebook user opens the app 10 times a day.
The exact number as reported by Data Reportal is 320.3 times per month. That means during our waking hours, the average person is checking Facebook every hour and 48 minutes.
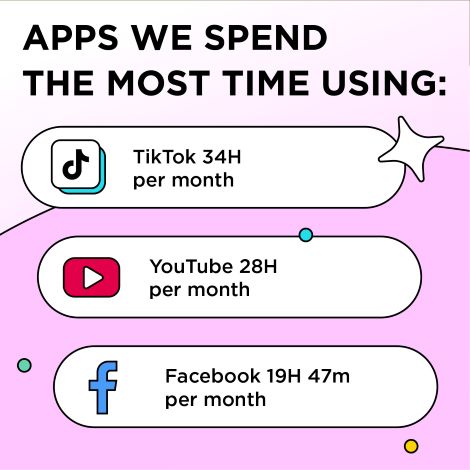
#7. The average Facebook user spends 19 hours and 47 minutes on the app every single month.
That’s about 39 minutes a day. Just on Facebook! In comparison, users spend 15 hours and 50 minutes a month on Instagram, 28 hours and 5 minutes a month on YouTube, and a staggering 34 hours on TikTok each month. These figures highlight Facebook’s significant, yet comparatively moderate, role in users’ digital lives across age groups, with TikTok leading in engagement time, followed by YouTube, and then Instagram.
#8. FYI, 8 in 10 Facebook users access the platform exclusively via mobile.
According to Data Reportal, 82 percent of Facebookers are using their mobile devices to access the app. This mobile-first reality provides a clear directive for marketers to optimize their campaigns for mobile users.
Facebook Content Engagement: What Are People Loving on FB?
#9. More than 7 in 10 Facebook Users are using it as a messaging app.
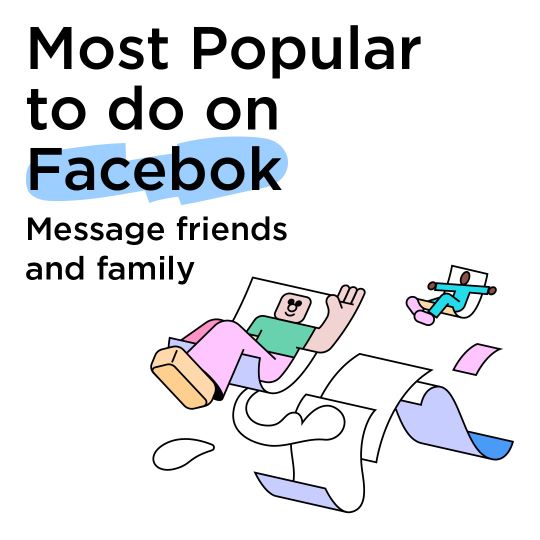
The go-to apps for sending messages to family and friends are Facebook 72.6 percent followed by Instagram, where 58 percent of users are messaging friends and family. (Data Reportal 2024 Digital Overview Global Report, Slide 242)
#10. About 6 in 10 Facebook Users use the platform to post or share photos and videos.
According to Data Reportal (Slide 242), 63.5 percent of Facebook users engage with the platform to post or share photos and videos, highlighting its role as a visual storytelling medium. This trend underscores the importance of multimedia content in social media interactions, with users favoring visual updates to connect with friends and family, share experiences, and document their lives. This preference for photos and videos aligns with broader social media trends where visual content drives higher engagement and fosters a more interactive and immersive user experience. Facebook’s features like Stories and Reels further facilitate this trend by providing dynamic ways for users to share and view visual content.
#11. Photos generate the most engagement for page posts.
With an average engagement rate of 0.10 percent, static images outperform non-Reels video posts on Facebook by 25 percent. Again, these are photos posted directly to your Facebook page but don’t include videos posted as Reels. (Data Reportal 2024 Digital Overview Global Report, Slide 286)
#12. Nearly 1 in 3 (30%) of people Facebook users regularly get their news on Facebook.
This makes Facebook the most popular social media platform for delivering news, followed by YouTube, Instagram, and TikTok.
#13. Page posts with links make up the majority of content posted to Facebook.
A touch more than 45 percent of all page posts shared on the platform include outbound links. Photos come in second at 32 percent, followed by videos at 18.6 percent.
#14. Square videos perform 35 percent better on mobile than landscape.
So, if you’re wondering whether you should go portrait or square, there’s your answer. Regardless of which social media platform you prefer, the chances are pretty good that platform is prioritizing video, whether long-form or short-form. And just an FYI, if you can grab 10 seconds or more of attention, your video’s considered a success on Facebook.
#15. Nearly 3 in 4 Facebook videos are watched without the sound.
Yes, 74 percent of Facebook videos are watched without sound, so make sure video content is captioned and can be understood and enjoyed without needing audio. On Facebook, compelling visuals outrank sound every time.
Using Facebook as a Marketing Channel
#16. Nearly 9 in 10 marketers use Facebook as a marketing channel.
According to Statista, 89 percent of marketers use Facebook as a marketing channel, making it the most popular social media channel among marketers. Instagram follows closely behind at 80 percent, followed by LinkedIn at 64 percent.
#17. More than half of Facebook users rely on the platform to research brands.
In fact, 54 percent of Facebook users are using the platform to research brands.
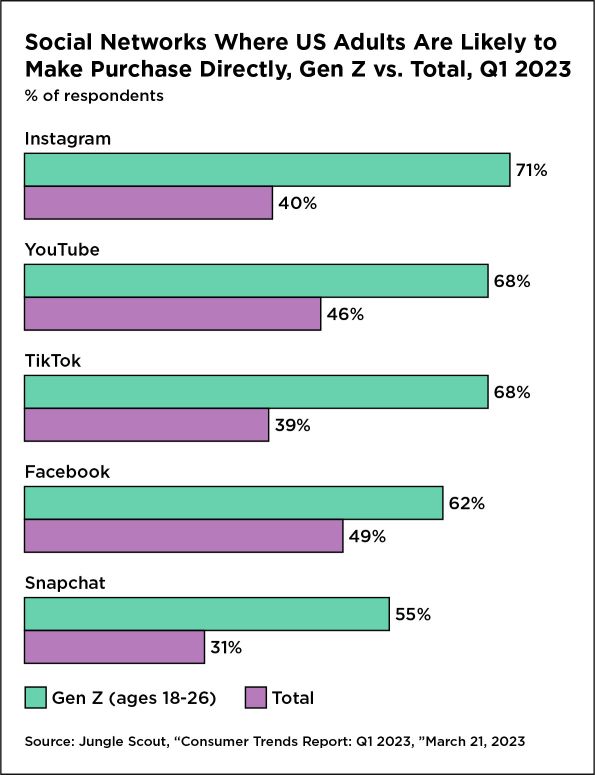
#18. Nearly half of social shopping adults shop directly from Facebook.
You may be surprised to know that Facebook is the most popular social media app for social commerce among U.S. adults with 49 percent of adults planning to shop directly from the platform. While younger consumers tend to favor Instagram for social shopping, among all U.S. adults, Facebook is the preferred platform, followed by YouTube then Instagram.
#19. Nearly 72 percent of Facebook’s audience can be reached with FB ads.
And 41 percent of total Internet users can be reached with Facebook ads. By comparison, Instagram ads reach 30 percent of all Internet users while YouTube ads reach 46.6 percent of all Internet users.
#20. Nearly 72 percent of Facebook’s audience can be reached with FB ads.
And 41 percent of total Internet users can be reached with Facebook ads. By comparison, Instagram ads reach 30 percent of all Internet users while YouTube ads reach 46.6 percent of all Internet users.
#21. Men are more likely to be reached with Facebook ads than women.
It’s also worth noting that across age groups, men are more likely to be reached with Facebook ads than women. A full 32 percent of Facebook’s advertising audience is men between the ages of 18 and 34, while 22 percent of women in the same age can be reached by Facebook ads. (Data Reportal 2024 Digital Overview Global Report, Slide 276)
2024 Facebook Stats in Summary
Facebook’s extensive reach and detailed user engagement statistics provide a fertile ground for targeted marketing strategies. Understanding these Facebook stats can lead to more effective and impactful marketing campaigns. Some key takeaways from the 2024 Facebook stats to carry into your next campaigns:
- Optimize for mobile
- Consider the best times to post
- Focus on high-engagement content types like image and video
In an era where digital spaces are continually evolving, Facebook remains a critical platform for marketers. Especially if you aim to connect with a broad and engaged audience. We hope these Facebook stats help you harness the full potential of the platform’s vast network. If you’d like assistance applying the latest Facebook stats to your next campaign, we can help. Schedule a strategy call with one of our experts today. We’ll help you build campaigns that best suit your brand and achieve your goals.

ABOUT THE AUTHOR
Abigail Welcom | Marketing Magician
Abby wins hearts and gains trust as our Brand Marketing & Outreach Coordinator. She puts her Film and Television Production degree to good use dreaming up visual marketing for The Shelf. When she’s not dazzling us with out-of-the-box ideas, you can likely find her at The Happiest Place on Earth — Disneyland!


